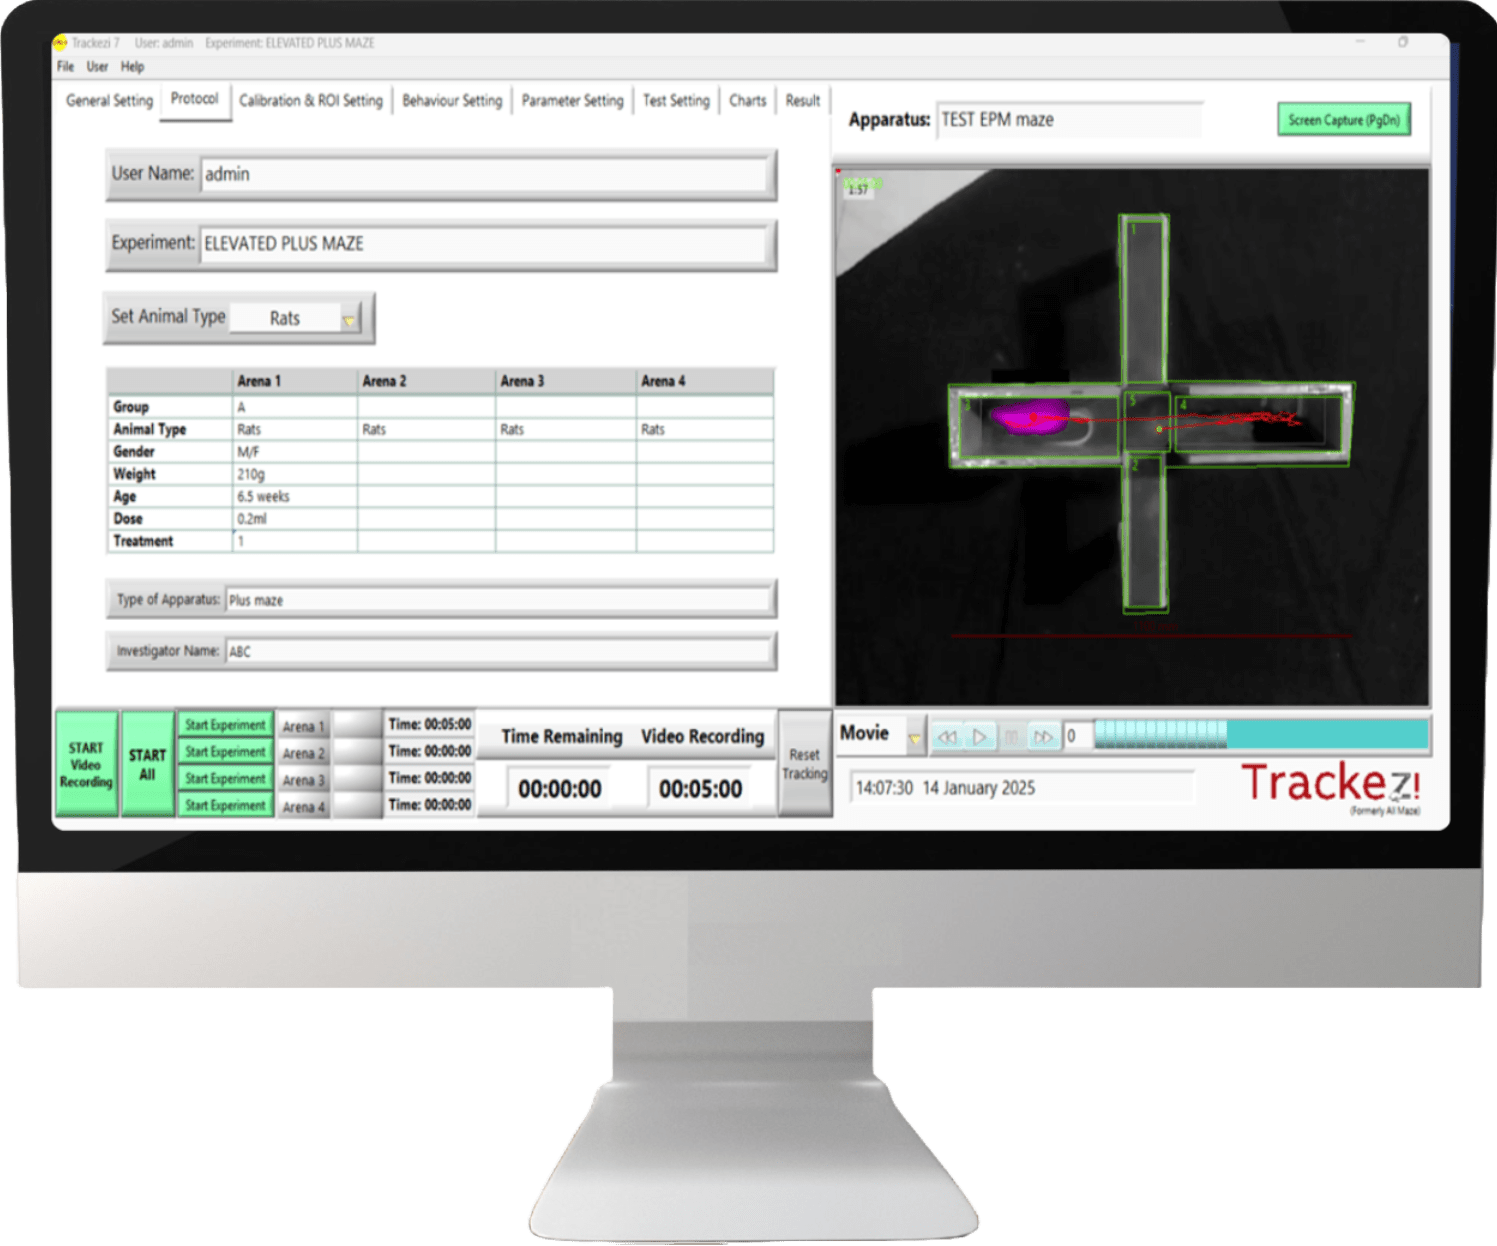

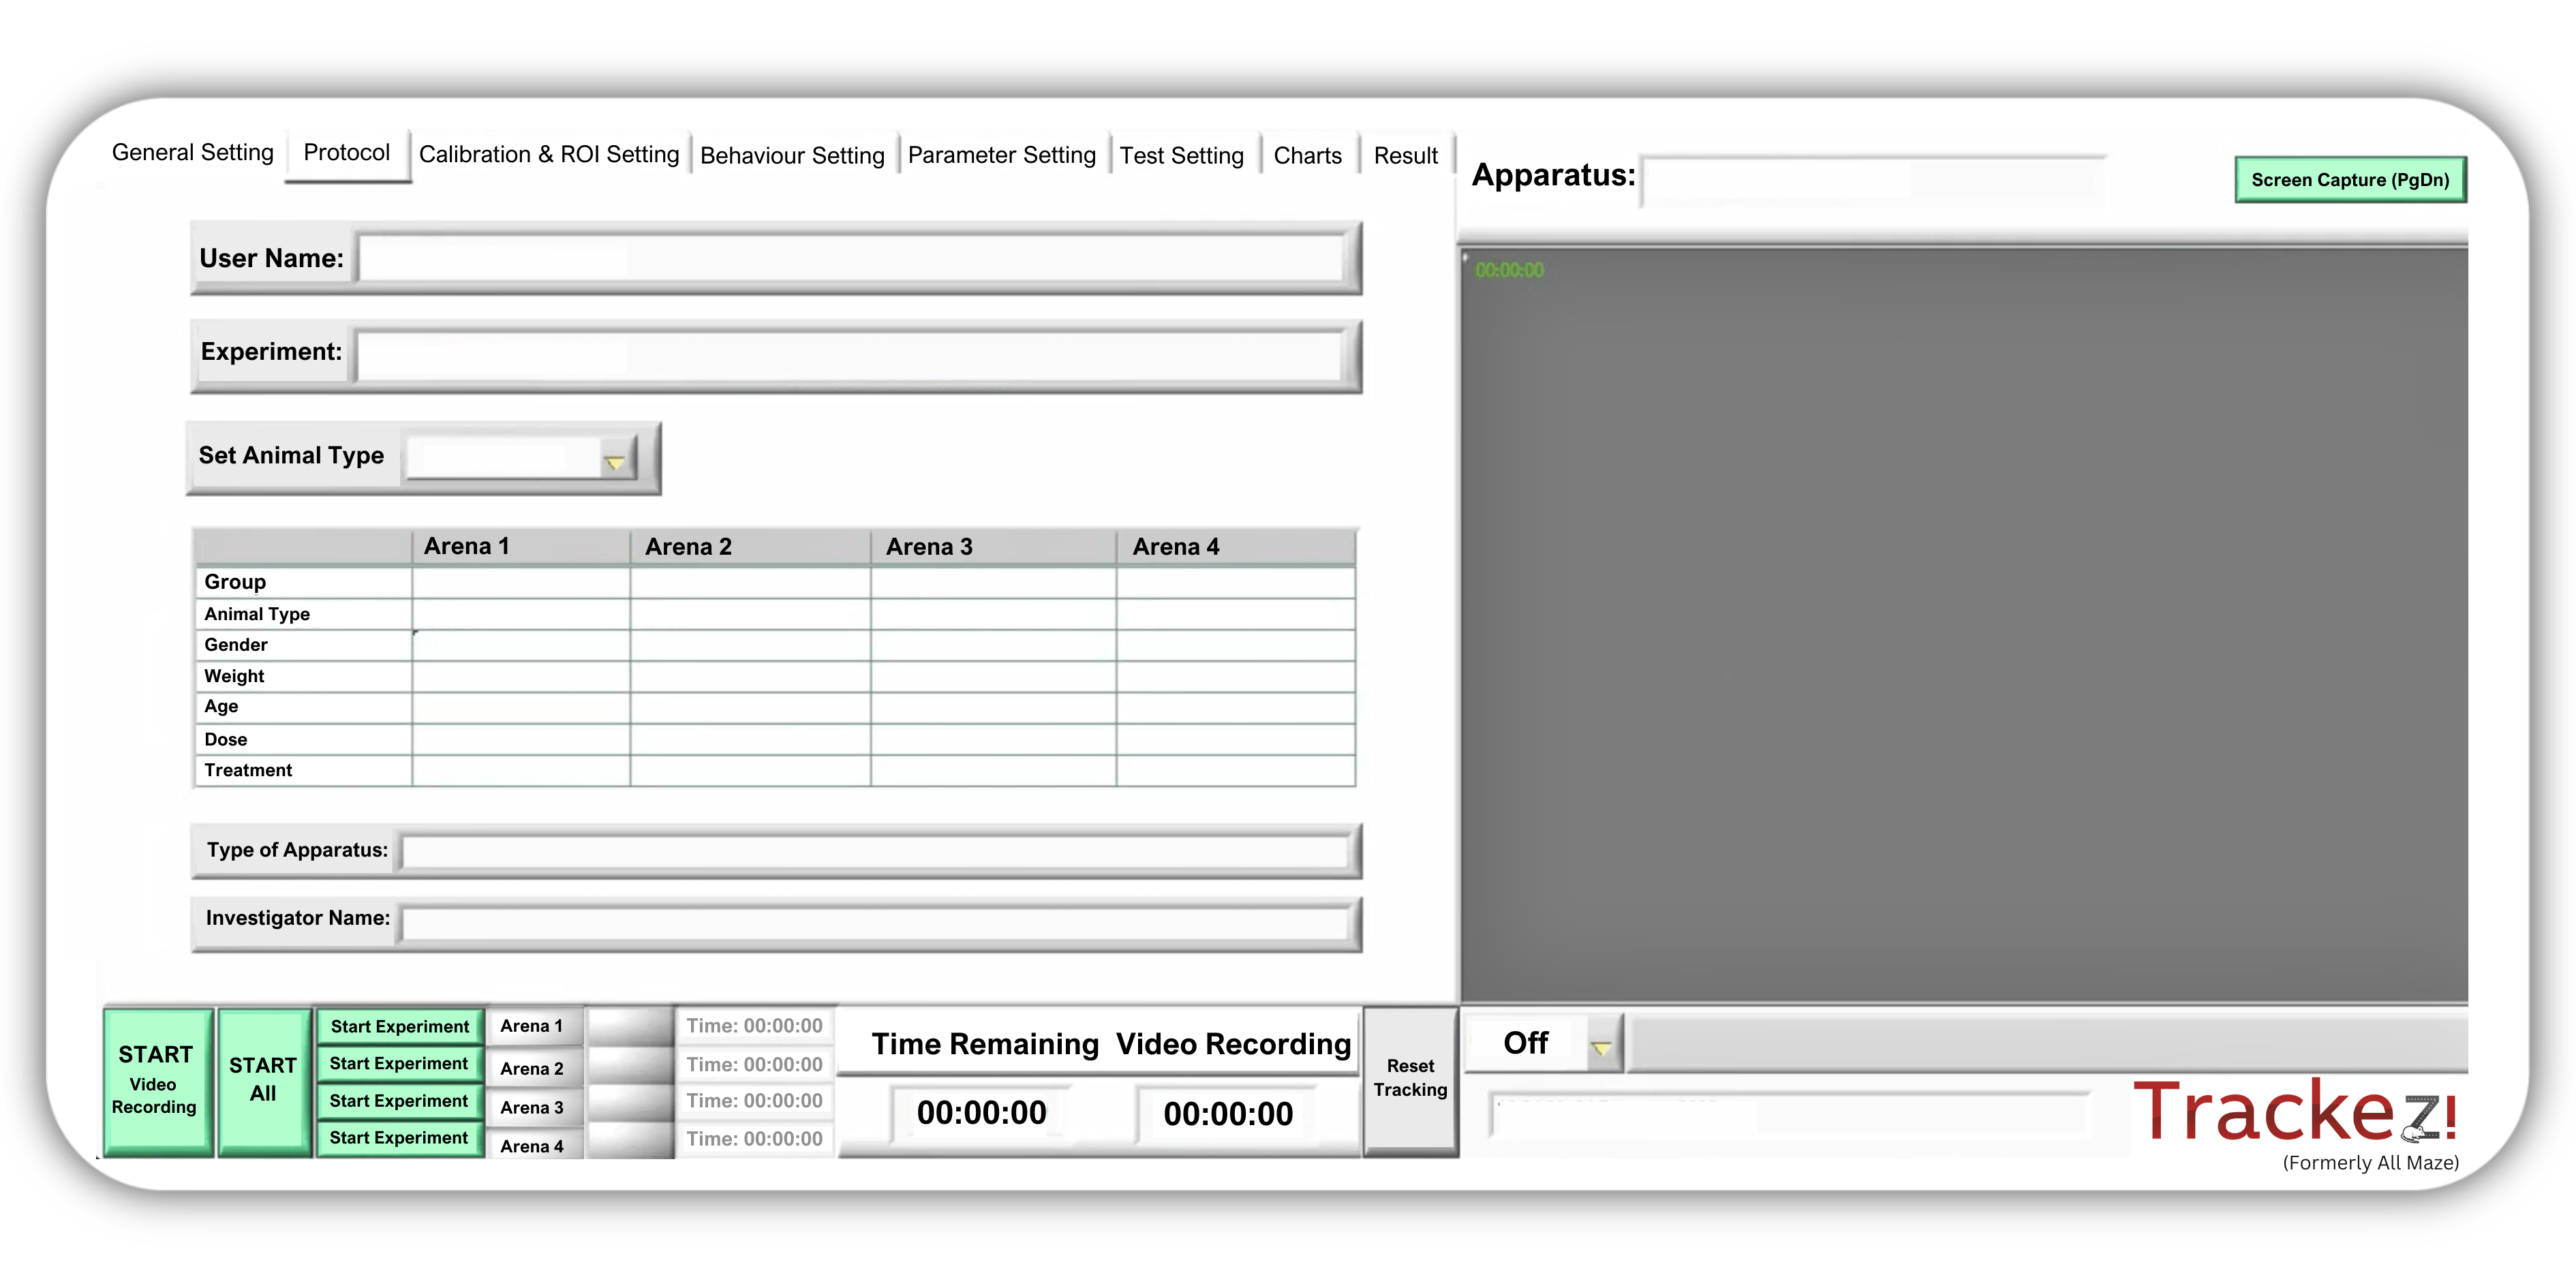
User Friendly Dashboard
Trackezi is designed with the daily experimental process in mind, featuring an intuitive interface and a flexible structure that adapts to various applications.
It ensures data reliability and enhances productivity, ultimately saving time and resources.
High-Precision Tracking
Useful for complex Arenas and ROI’s
Offers detailed analysis of specific regions by allowing customization of the study arena's size, shape, and features. It highlights key zones where animals spend time, interact with objects, or display behaviors. Additionally, it supports simultaneous tracking of up to four rodents for comprehensive behavioral studies.
Track effortlessly with accuracy
User-friendly interface with intuitive design for easy parameter selection from a ready list. Simplified controls ensure an efficient workflow, minimizing the need for additional motion detection sensors in mazes. Compatible with both pre-recorded videos and online experiments.
Track precisely even in dim light or low contrast
Accurate tracking with minimal contrast, adapts to low light, and reduces visual noise using sharpness, brightness, and contrast functions.
Best-in-class flexibility
Flexibility to customize the experimental procedure
The system allows users to capture images with a single click and save images of the overall tracking line. It presents data in a clear, easy-to- understand format and enables seamless transfer of results to Excel for further processing or reporting. Additionally, it includes entry and exit indicators for precise tracking.
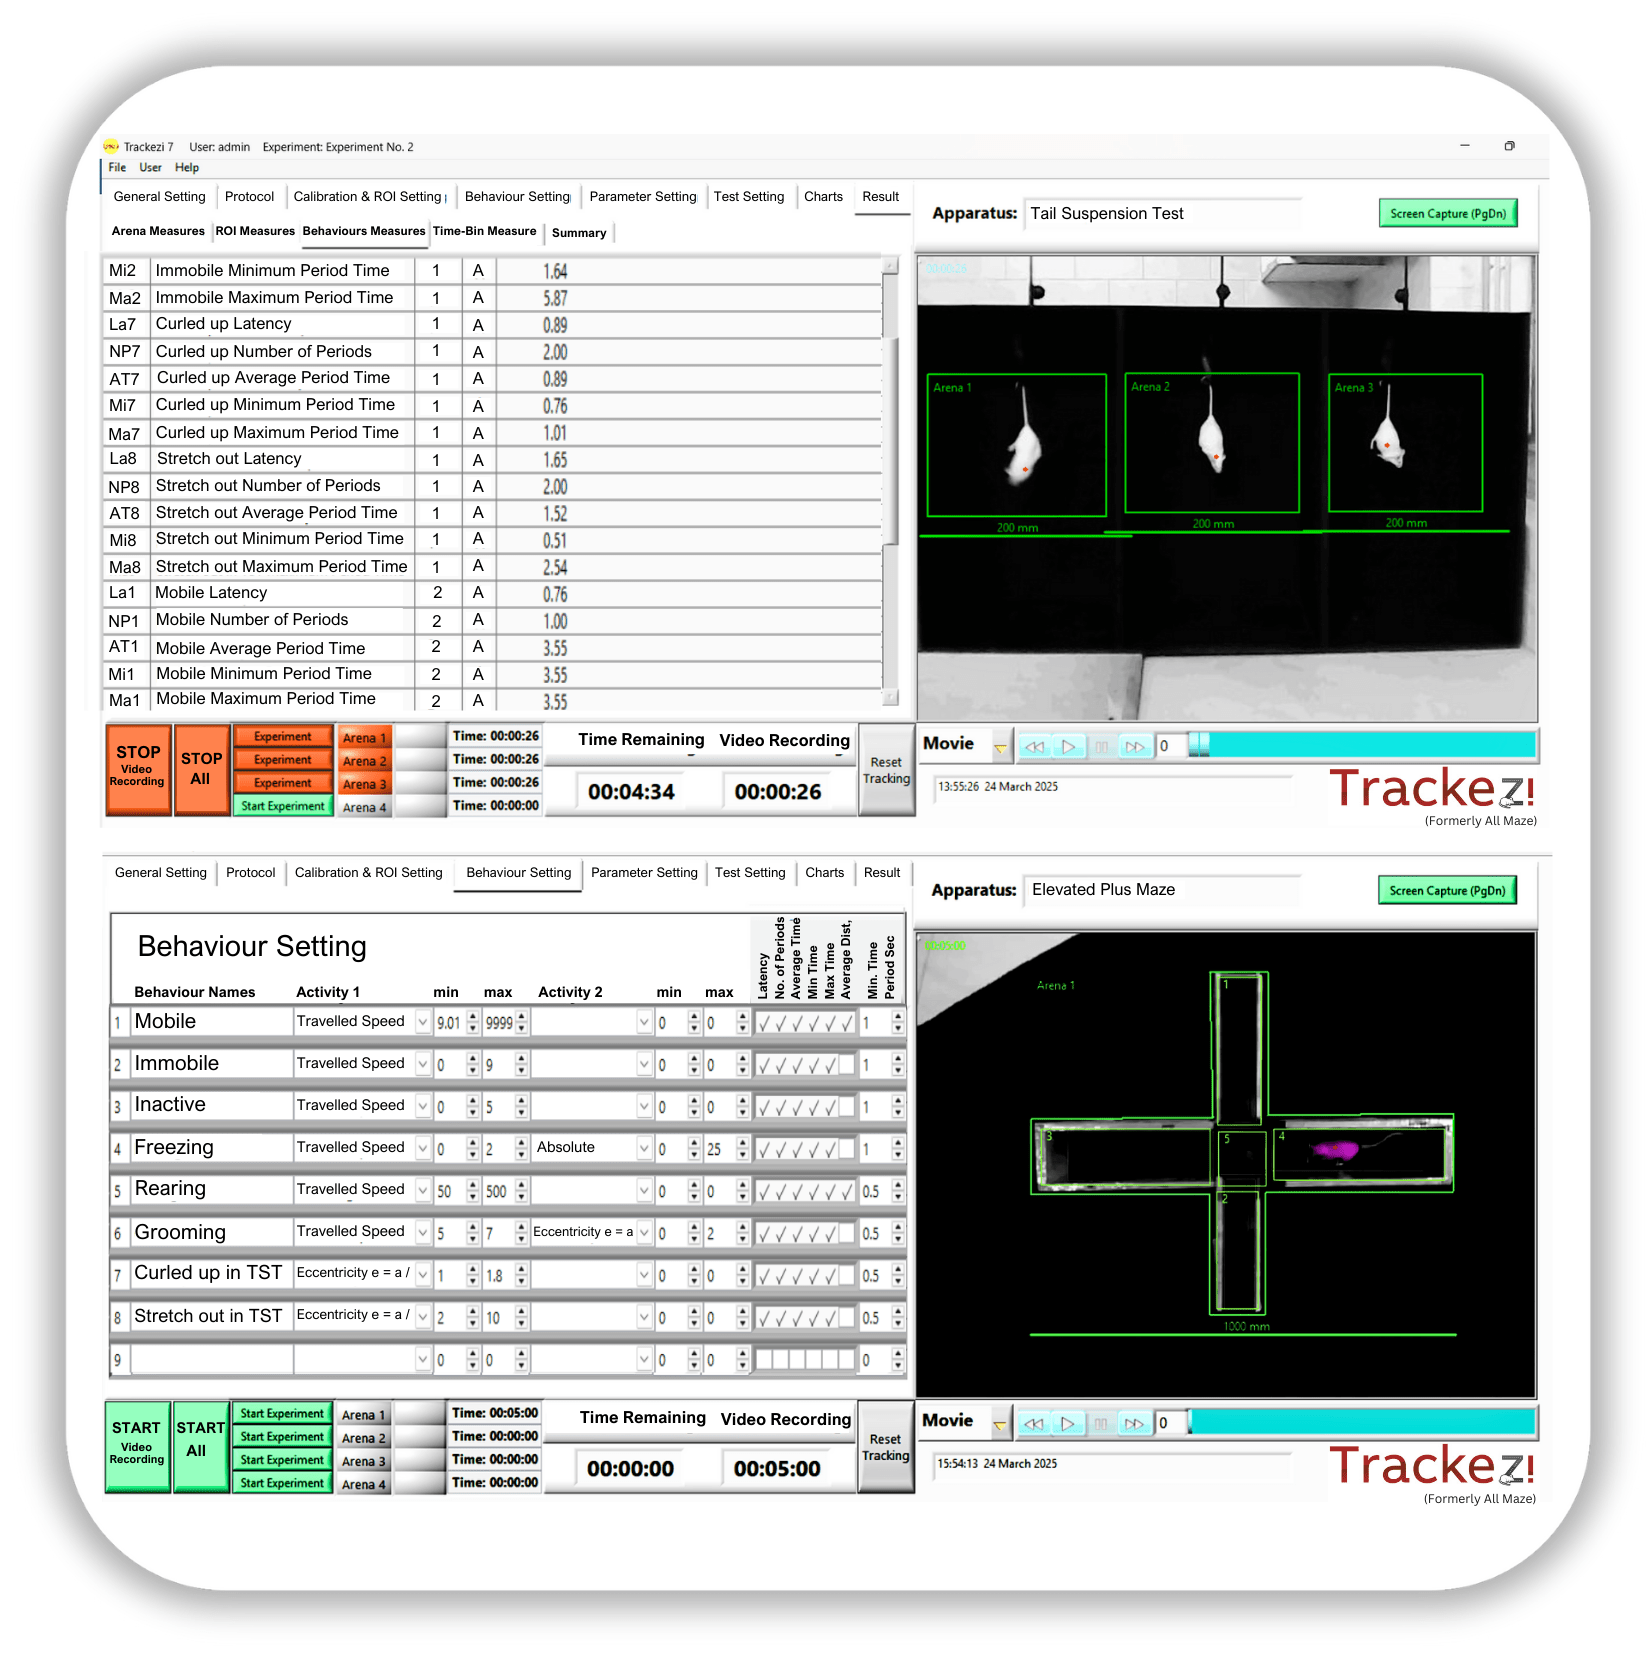
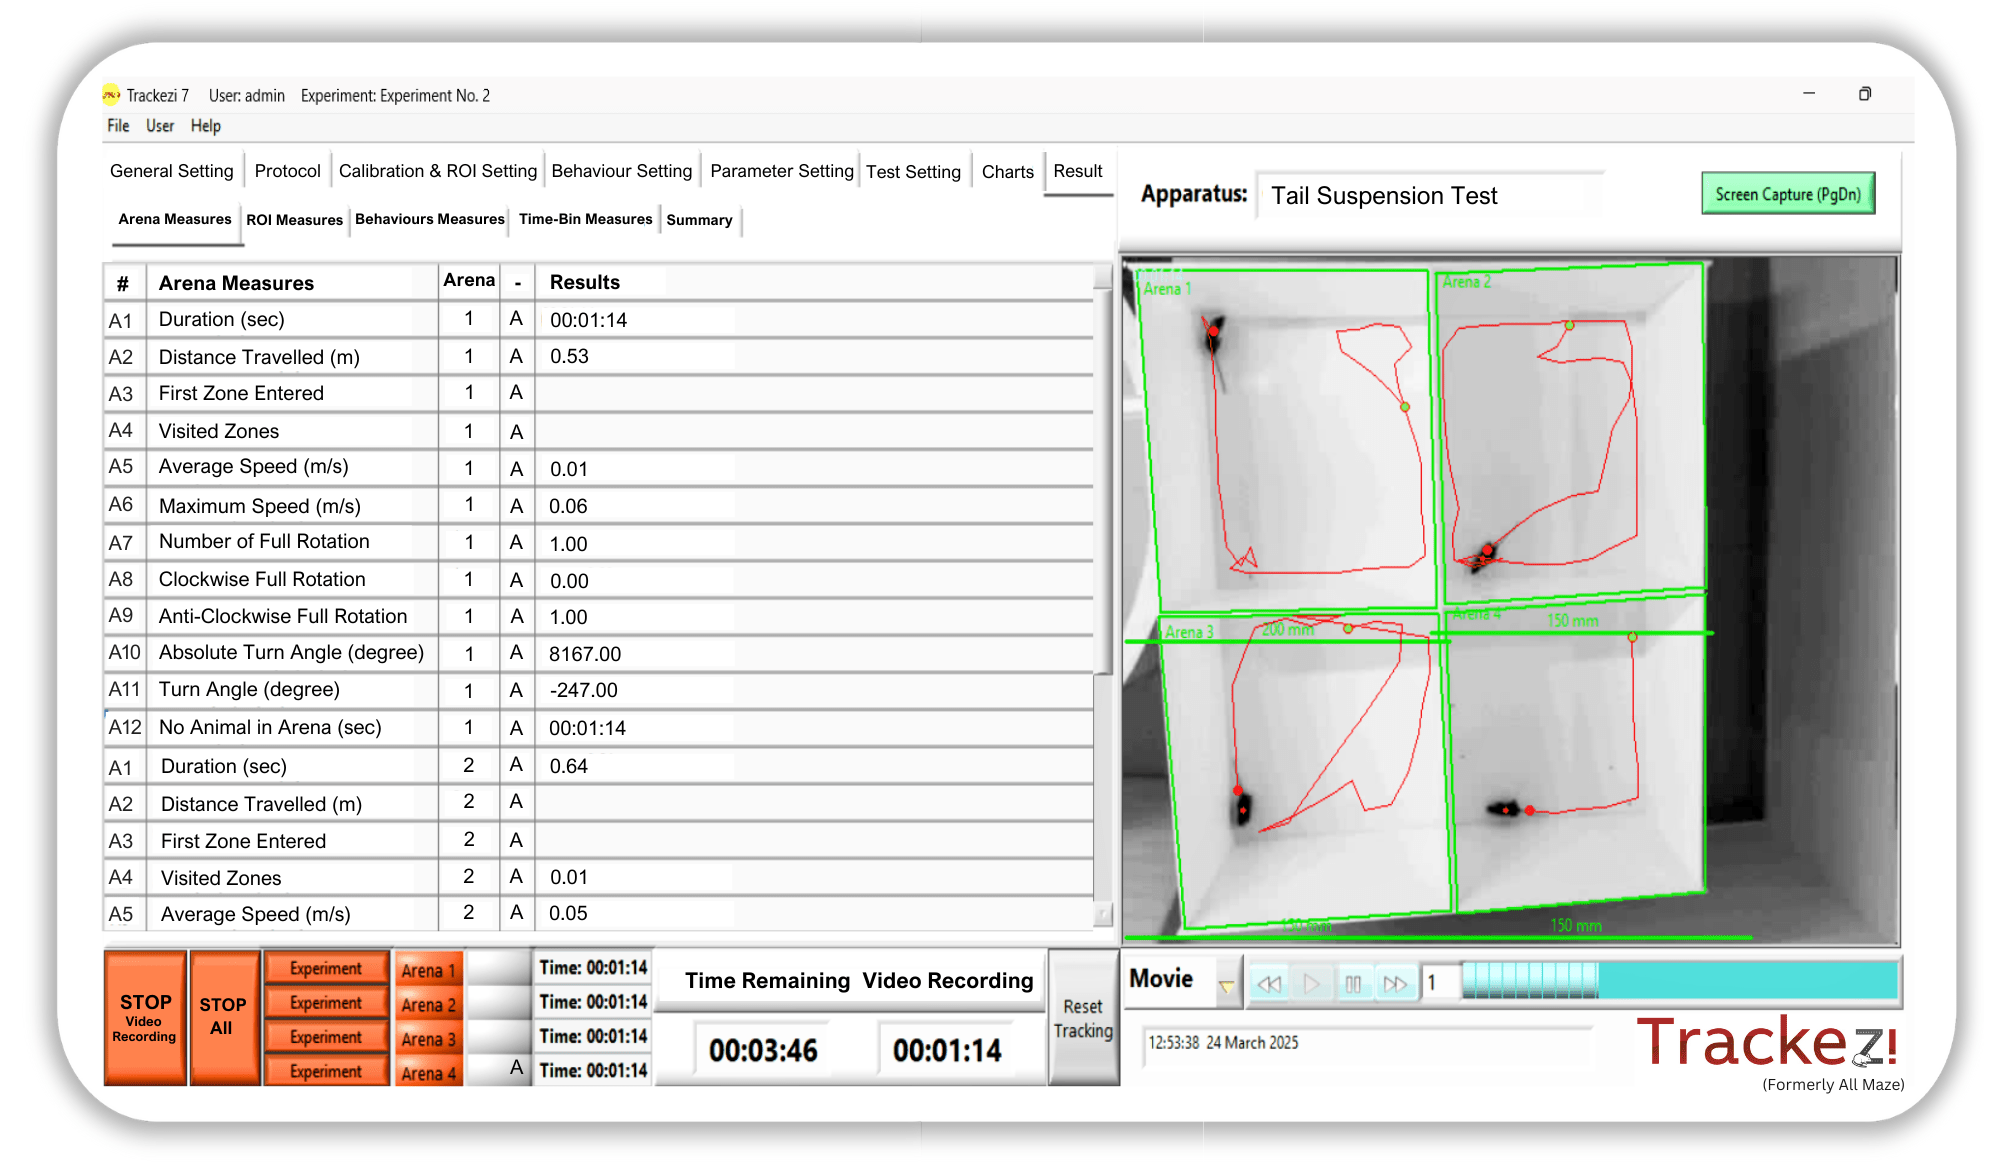
offers customizable protocols to adapt to changing conditions or objectives, allowing precise data collection through adjustable parameter thresholds. It provides flexibility for specialized experimental settings, such as individual recording options for the tail suspension test. Users can also define custom measurement parameters beyond the standard list. Additionally, saved configurations enable quick reuse, minimizing experiment time and enhancing efficiency.
Effortlessly design complex Arenas and ROI’s
Allows detailed analysis of specific regions by customizing the size, shape, and features of the study arena. It identifies key zones where animals spend time, interact with objects, or exhibit behaviors. Additionally, it supports simultaneous tracking of up to four rodents for comprehensive behavioral analysis.
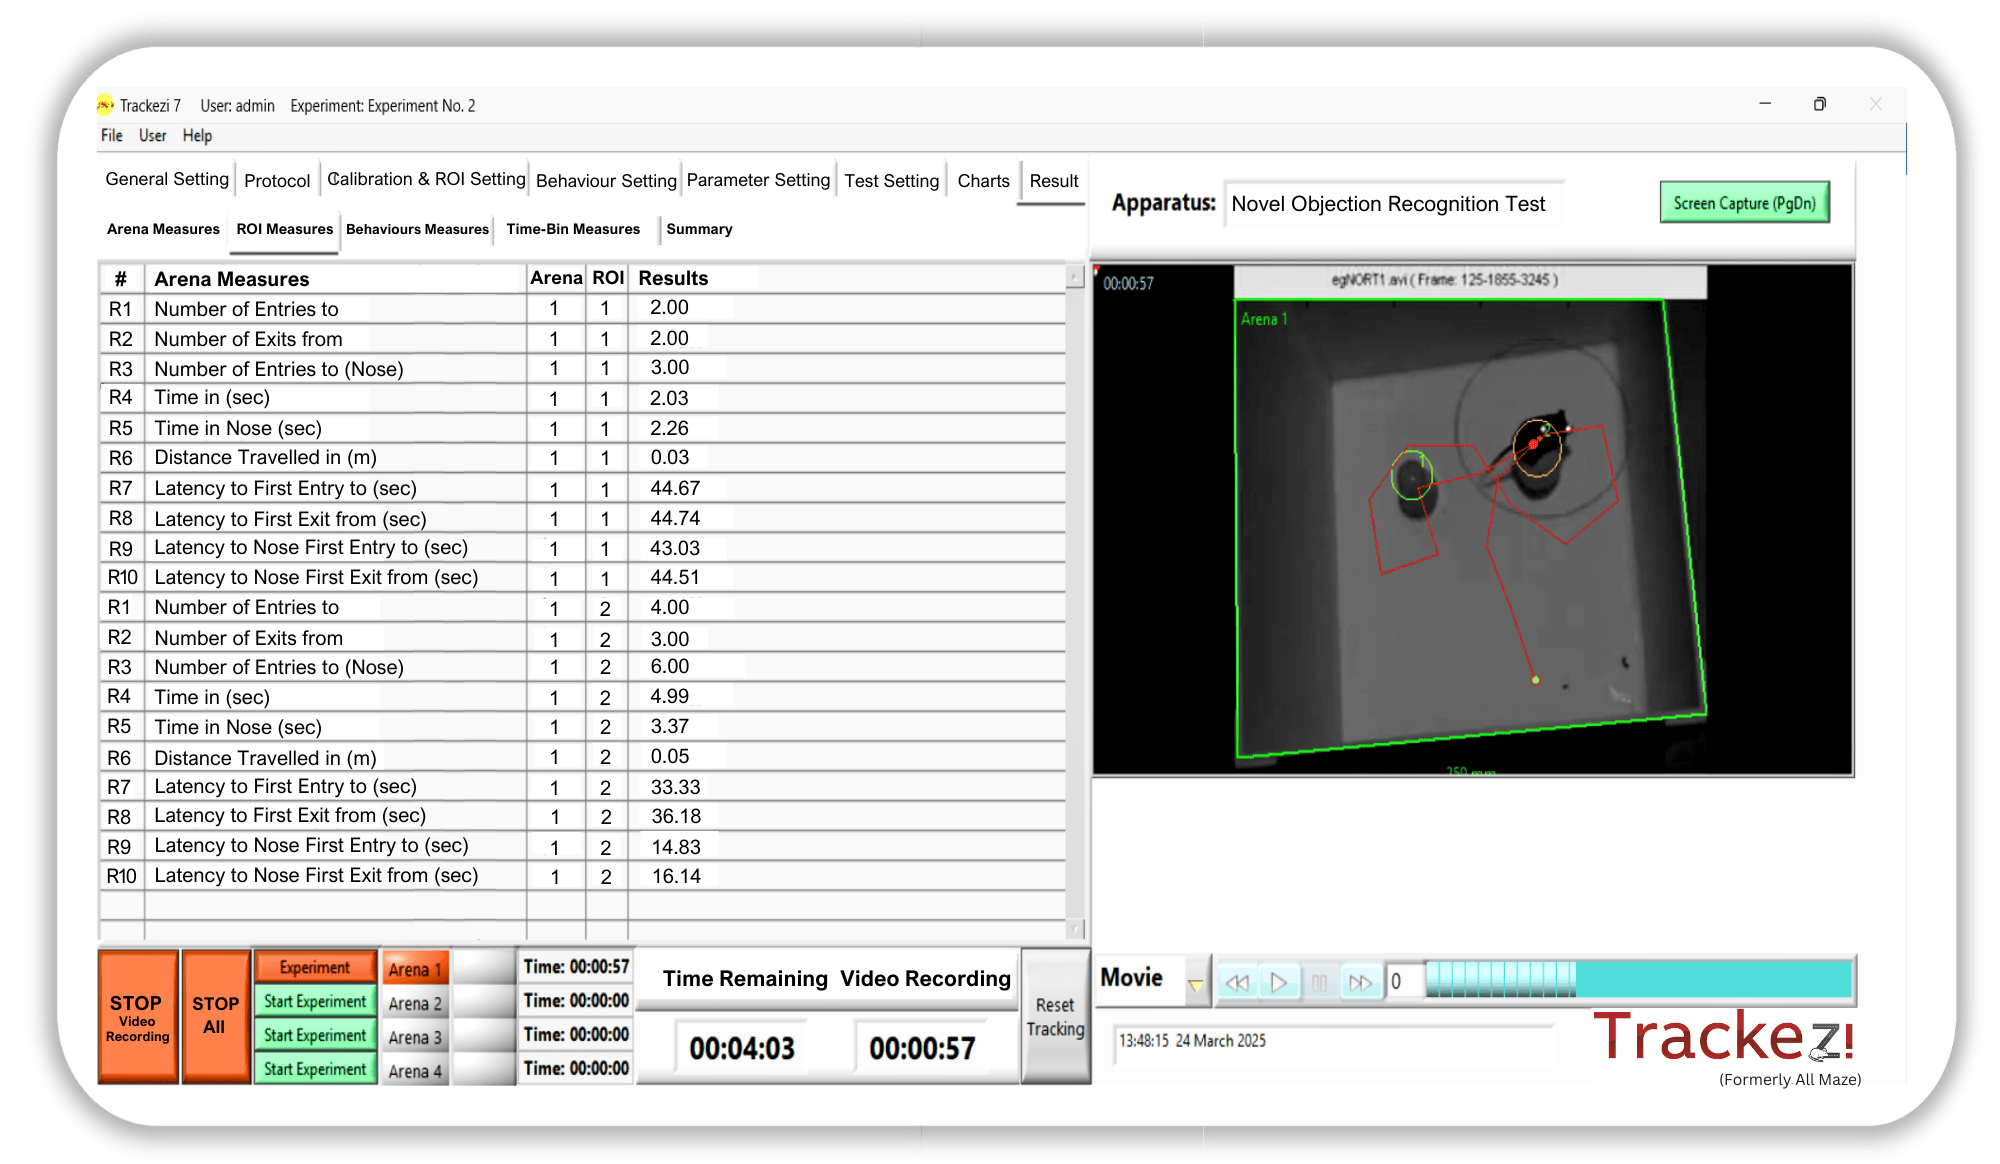
Track entire animal parameters or only parameters related to the nose.
Tracks full-body movement for behavior analysis, focusing on nose-related parameters such as the number of nose entries, time spent in the nose zone, latency to first nose entry, and latency to first nose exit in novel object recognition or nose poke tasks.
Next-Gen Experiment Management
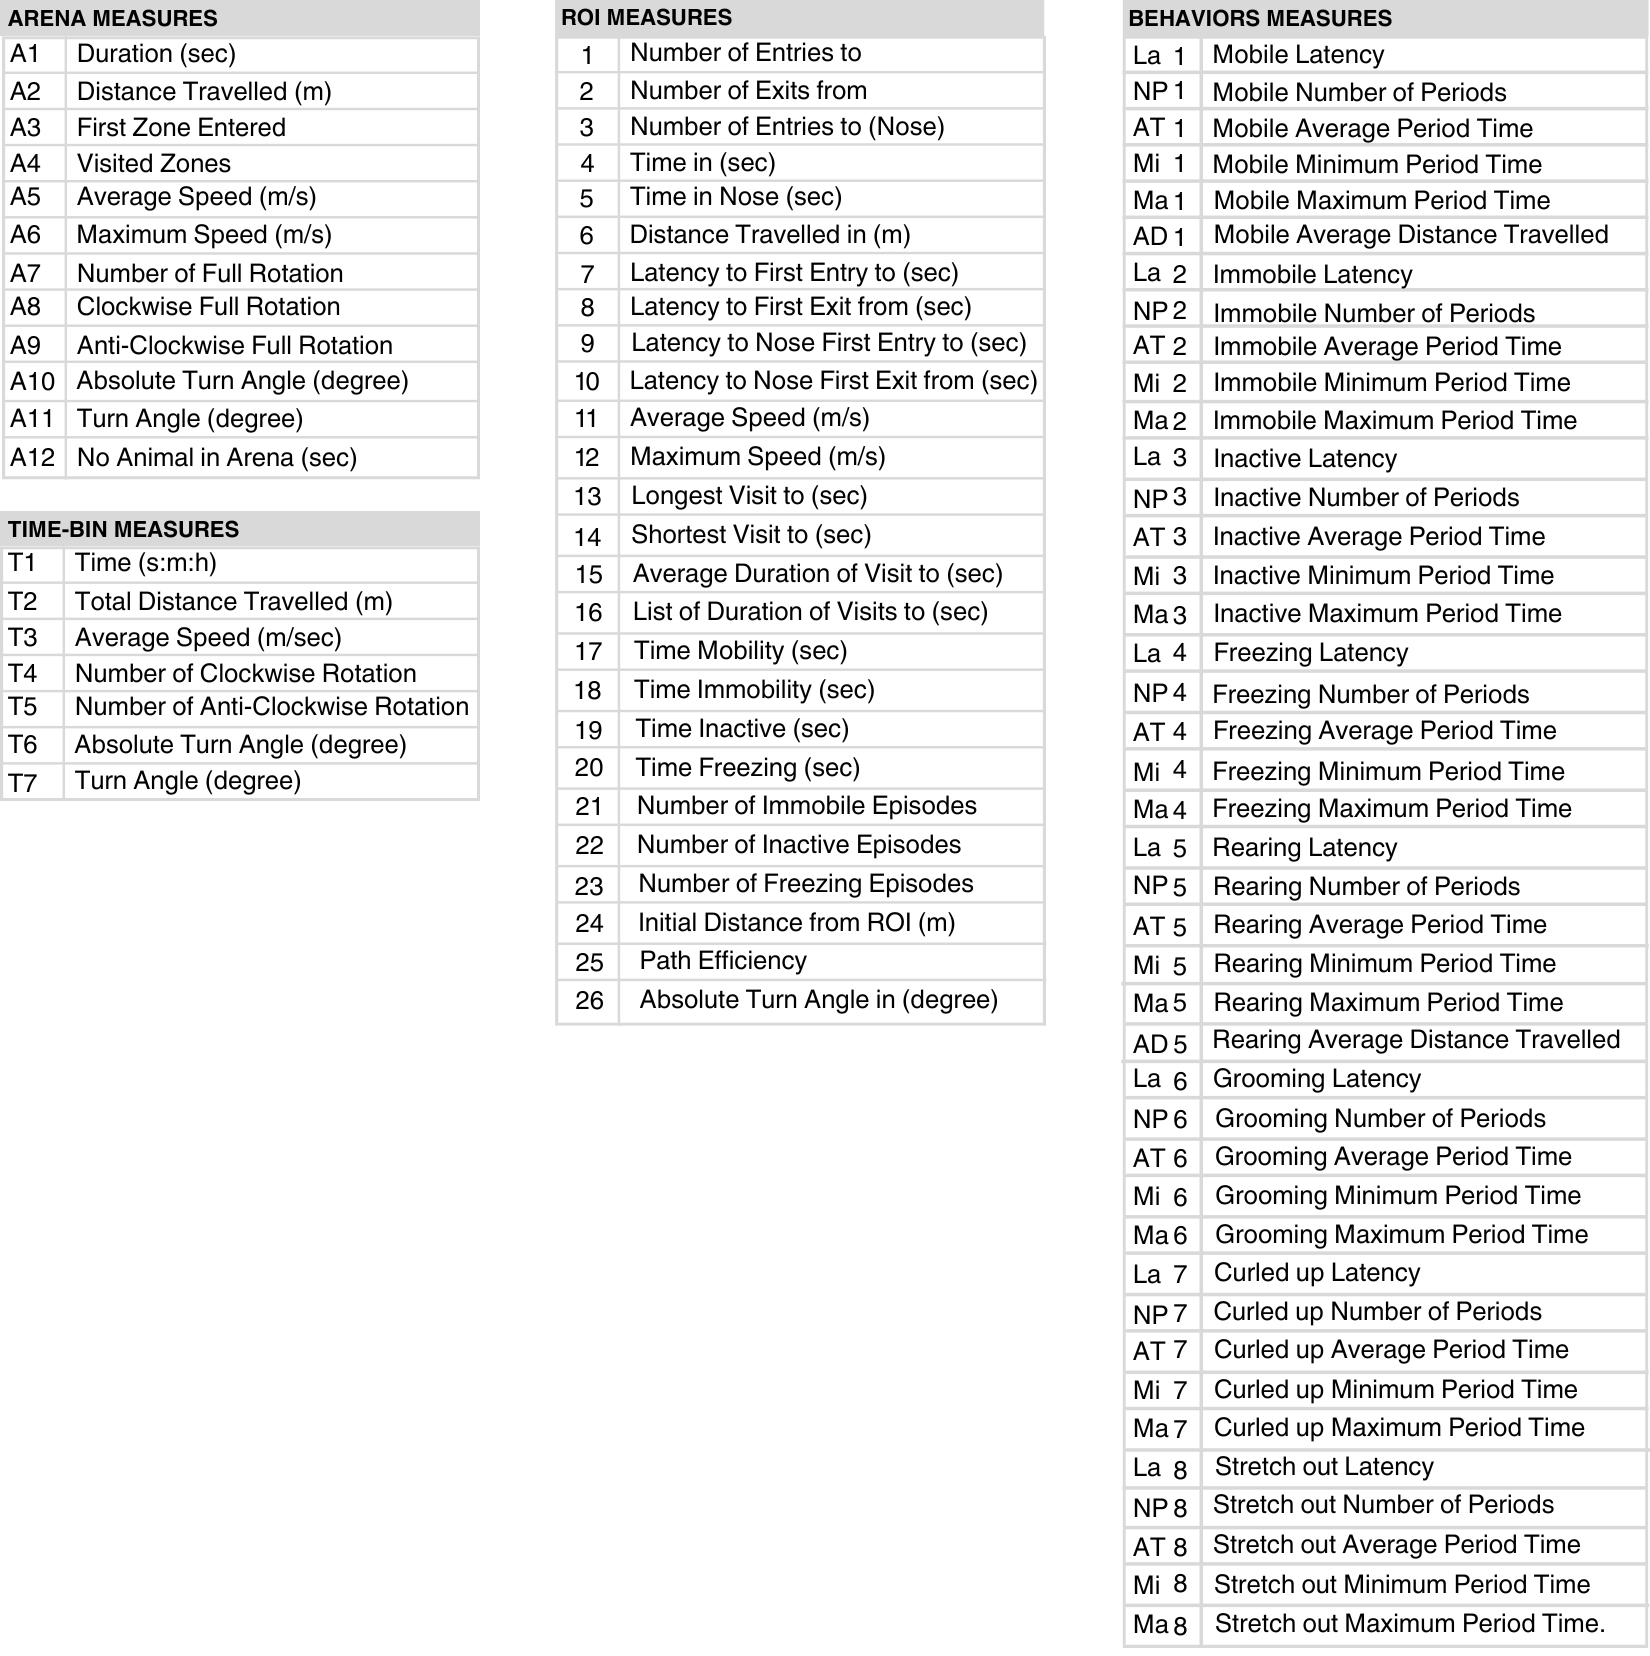
Measures extensive list of parameter – Arena, ROI, Behaviour, Time bin.
Arena Parameters:
Measure overall activity and movement within the arena.
ROI Parameters:
Track activity and movement in specific zones of the arena.
Behavior Parameters:
Measure movement and behaviors like immobility, freezing, rearing, grooming, and inactivity.
Time Bins Parameters:
Set intervals for accurate behavior measurement.
Select more than 80 parameters for measurement
Graphically represent and analyze outcomes
Activity Graph
Entry & Exit Analysis

Visual representation of Travelled Speed, Head Movements, Absolute Rotation, Rotation, Eccentricity, and Head Brightness Relative to Body.
Bar graph with color-coded ROI and Arena, indicating the highest to lowest entry and exit points.
Time Spent Analysis
Heat Map
Start & End Point Indicators

Bar graph showing time spent in each ROI relative to its Arena.
Highlights activity intensity with a time-based color gradient from highest to lowest.
Green for the start point and red for the end point.
Graphically represent and analyze outcomes
Activity Graph:

Visual representation of Travelled Speed, Head Movements, Absolute Rotation, Rotation, Eccentricity, and Head Brightness Relative to Body.
Time Spent Analysis:

Bar graph showing time spent in each ROI relative to its Arena.
Heat Map:

Highlights activity intensity with a time-based color gradient from highest to lowest.
Entry & Exit Analysis:

Bar graph with color-coded ROI and Arena, indicating the highest to lowest entry and exit points.
Start & End Point Indicators:

Green for the start point and red for the end point.
Gives Reliable and Reproducible Results
Ensuring Consistent Outcomes, Minimizing Errors, and Maintaining Data Integrity.
Introduction to Trackezi
This guide provides an overview of setting up, conducting an experiment, and analyzing results using Trackezi

A deal like no other

No hidden costs
Trackezi LL includes all features
at one affordable price - no pricey add-ons required.

Unlimited Support
Trackezi LL users receive free,
unlimited online support from our highly acclaimed team - forever.

Lifetime access to updates
All Trackezi LL users will receive free
updates for every new version
of Trackezi, forever.
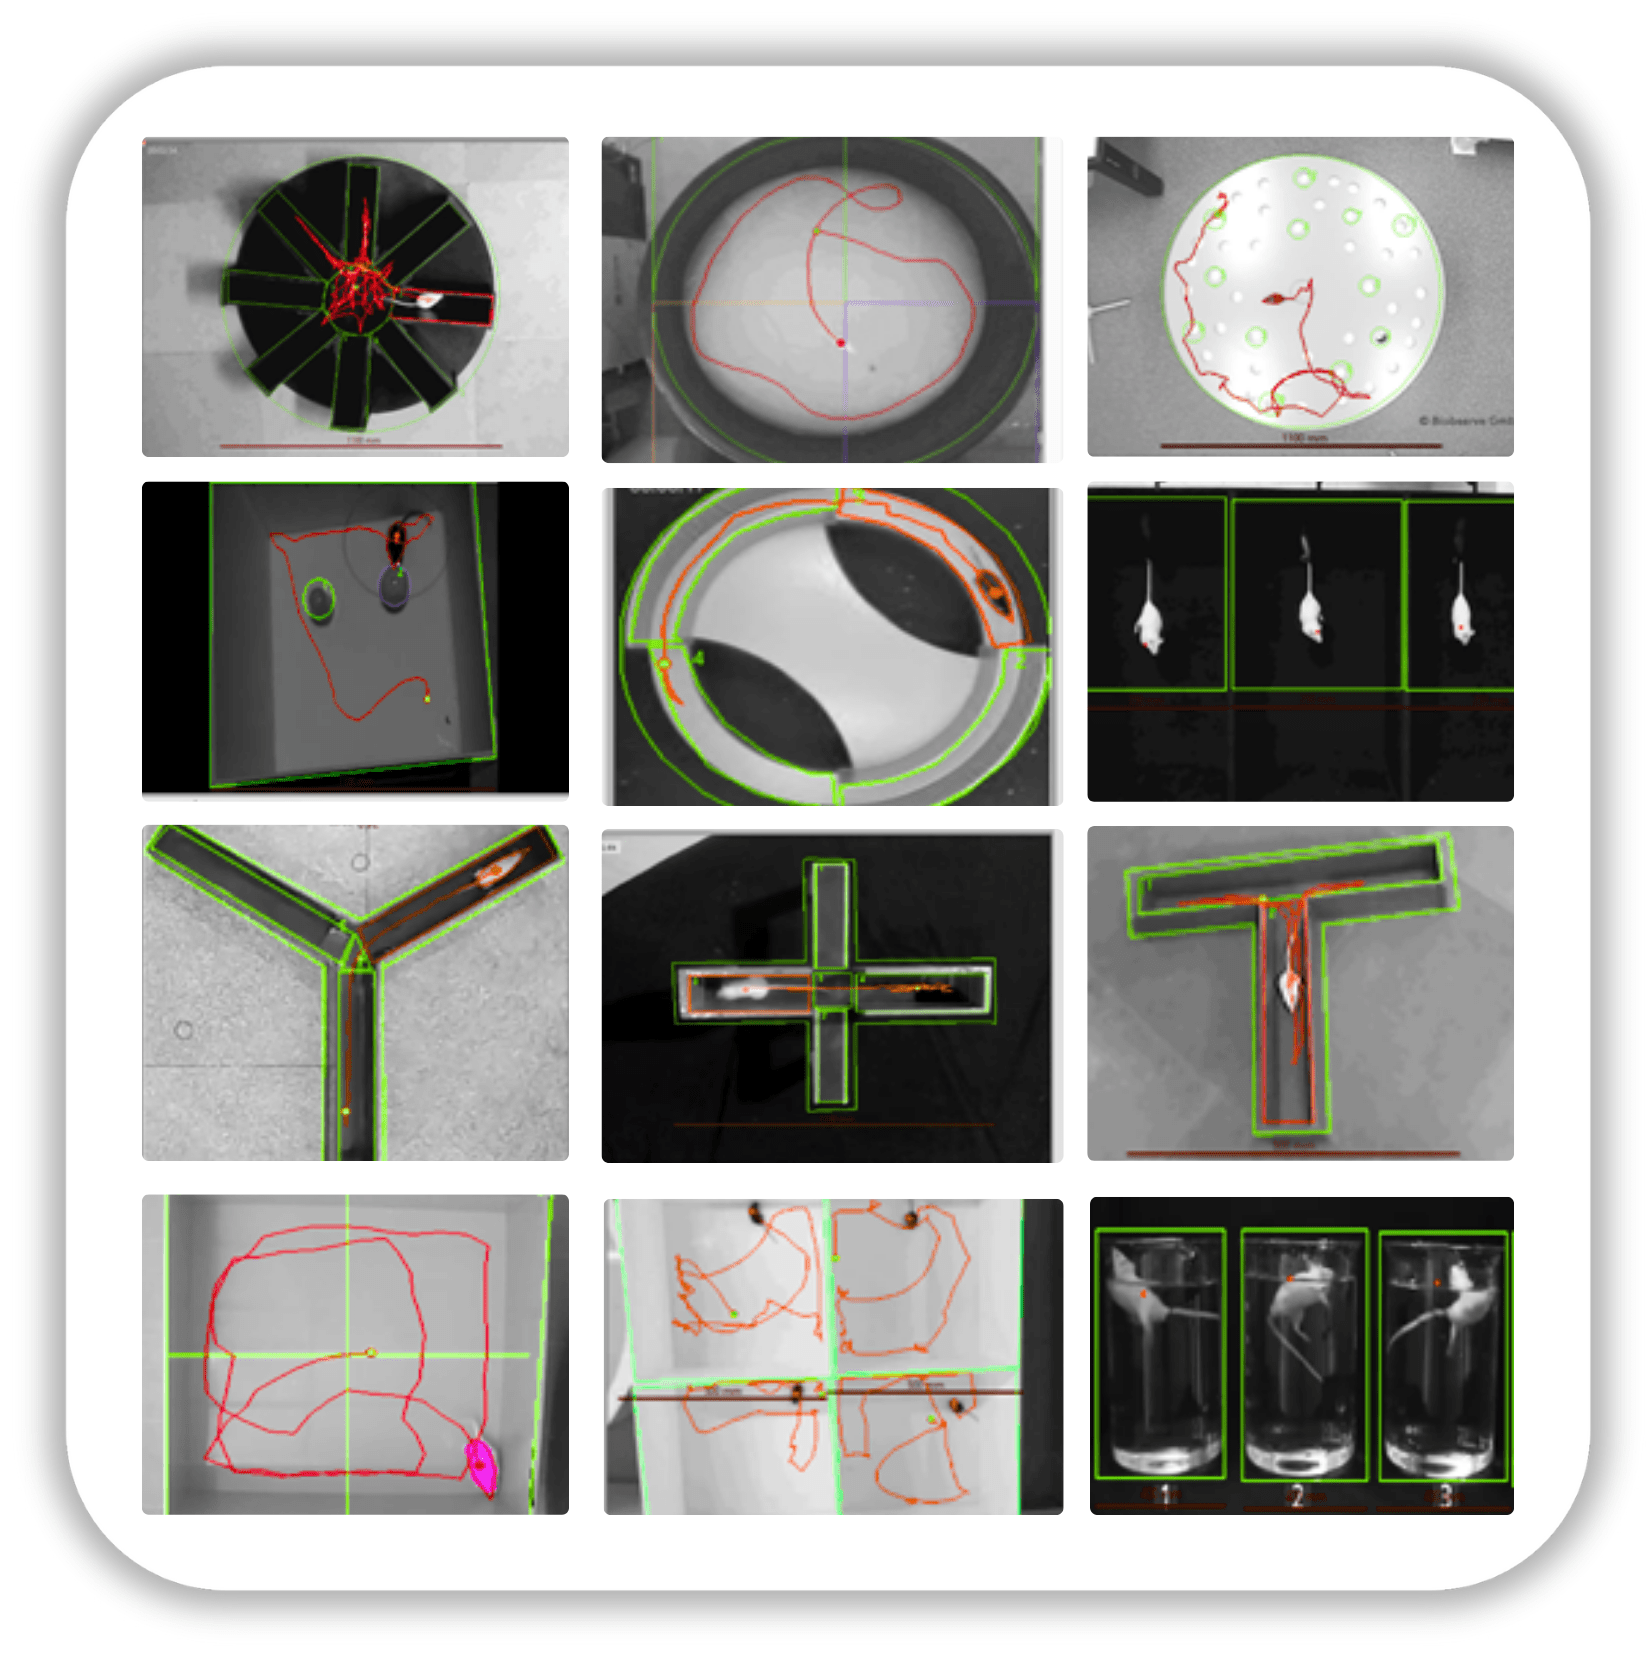
Mazes and Test Apparatus


